

PROBLEM STATEMENT
The Medtronic CRDN team briefed us to create an app to increase engagement for both new and existing reps with the extensive amount of training content. They hoped to increase retention and behavior modification from the training by increasing utilization of their offerings via gamification.
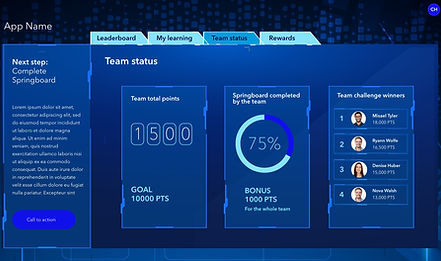
They wanted to create a leaderboard dashboard to show progress and scores between peers. The concept also included dashboards at individual levels to allow a rep to hit different ‘tiers’, or milestones, and through gamification between groups of people at similar stages of the learning journey. The reps will be able to compete on who has completed the most training or who has the best scores.
WORKING TOWARDS A SOLUTION
Some of ideas that we came up with to include in this app were:
-
Have a point and rank system to measure the progress of each rep
-
adding a leaderboard with the top ten reps with maximum points.
-
Add badges for various milestones like High Score, Star Presenter, Certified in a specific area etc.
-
Add bonuses for high performance in the trainings
-
Have the interface reflect the number of game and lessons that are available to you and the number that you have completed
-
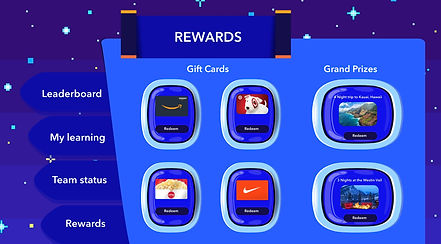
Have rewards like gift cards for the points accumulated
-
Have a journey map to show where you are at your training journey.
-
Create a page that is a one stop shop to see all your progress and status.
-
Create a leaderboard that also shows the ranking for different regions and countries
-
Reward the top performing countries and regions
-
Add fun elements to increase visual interest by having animated badges show up in pop-ups every time you log in. Confetti backgrounds, fun illustrations, and game board style interface.
-
Have a fun theme pushing the brand a bit so it doesn’t look too corporate style
MY LEARNING PAGE EVOLUTION
Round 1

-
Journey steps listed in a table format.
-
Points progression in an infographic on top.
-
Current points shown in a list.
-
Points that have not be earned are in deactivated state to allow the user to see what they can earn in the future.
-
Completed courses are listed with solid stars next to them.
Round 2

-
Journey steps listed in a journey Infograph based on client request.
-
Points progression shown as journey milestones with ones completed marked with checkmarks.
-
Current points shown at each milestone.
-
Bonuses earned and future bonus opportunities highlighted on the way.
-
Separate circle for taking the Pop Quiz.
-
Different states of flag to show the journey completion.
Round 3

-
Steps for product training and Presentation skills paths separated and then joined to complete the journey with
a final pop quiz. -
Check marks for the completed course.
-
Locked icons for the courses that the user does not have pre-requisites for.
-
Pencil icon on the course that needs to be taken next in the user journey.
-
Badges that can be earned shown through the journey.
-
Information about the current points, rank, trainings completed displayed on the top nav bar.
-
All the badges that are earned and yet to be earned are shown in the bottom right scrollable display.
Round 4

-
Two separate journeys combined to form one as the client made the trainings linear.
-
Check marks for the completed courses.
-
Pencil icon on the course that needs to be taken next in the user journey.
-
Badges that can be earned removed through the journey to avoid clutter.
-
Flags added to show completion of major milestones.
-
Pop Quiz has a separate place as it is not a part of the linear journey and can be taken anytime.
Round 5
-
Added the arrow marks to show the direction of the journey.
-
Check marks for the completed course.
-
Locked icons for the courses that the user does not have pre-requisites for.
-
hand icon on the course that needs to be taken next in the user journey.
-
Badges that can be earned are greyed out in the bottom scrollable list.
-
Reduced the flag to just one to show the completion of the journey.
-
Only one course is highlighted as an action item. The rest of the courses have been deactivated and grayed out.
-
Some courses are locked as the date is gone and the user did not complete those at that time.
-
Earned and future bonus icons are added in the journey.
-
A pulse is added to the action item course to make it stand out more.
-
Week numbers are added to make the process reflect that it is time bound.
INITIAL WEBSITE CONCEPTS
Sci-fi theme


Light Medtronic theme


Gaming Theme


BADGES


FINAL PROTOTYPE
The website helped the client to encourage their sales representatives to stay on track with their product and presentation trainings. They felt rewarded for their efforts while improving their skills. The leaderboard created a healthy competition at an individuals, region, and country level. The animated badges added a fun element to the experience. The client was very pleased with the design and outcomes of this app.


RESULTS
Hani Al Hariss, the project lead with the Sales Training group had this to say: “What we have achieved is very impressive. There is a lot of excitement about this program.”
Weekly reporting allowed the team to keep track of progress and identify any participants who needed an extra nudge to stay engaged.
-
About 90% of those selected for the program became active participants
-
Of the 44 active participants:
-
245 lessons and activities were completed
-
6.5 activities were completed, on average
-
About one-third of participants were really engaged and completed nearly all the activities and lessons assigned to them in the app.
-